
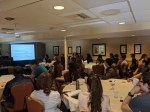
Highlights from our Satellite Event!
Visualization Meets Vision Science
Talk Schedule:
2:00-2:05 pm: Introduction
2:05-2:11 pm: Open vs Closed Perceptual Categories Persist in the Context of Overplotting and with Real-World Data – David Burlinson
2:17-2:23 pm: Perceptual averaging in visual communication: Ensemble representations in the perception of scientific data in graphs – Stefan Uddenberg
2:23-2:29 pm: Data Visualization in Introductory Psychology Textbooks – Jeremy Wilmer
2:29-2:35 pm: Using Analogies to Teach Novel Graphics – Emily Laitin
2:35-2:41 pm: Missing the forest and the trees in animated charts – Nicole Jardine
2:41-2:47 pm: Exploring Attention on Large-scale Visualizations using ZoomMaps, a Zoomable Crowdsourced Interface – Anelise Newman
2:47-2:53 pm: The role of spatial organization for interpreting colormap data visualizations – Shannon Sibrel
2:53-3:08 pm: All presenters on panel Q&A
3:08-3:23 pm: Guest speaker Brian Fisher
3:23-3:38 pm: JOV special edition editor presentation and Q&A
3:38-4:30 pm: “Meet & Greet” with refreshments


This event was sponsored by Adobe Inc., the Visual Thinking Lab at Northwestern, and Colorado Boulder’s VisuaLab.
