
Retrospective Application of the Design Space:
Download the supplementals here, or continue reading below…
This section explains how to use our design space retrospectively to understand and describe the correlation perception experiments performed in Rensink & Baldridge (2010). In this paper, the authors aimed to investigate and model the perception of correlation in scatterplots. More specifically, the authors used two common vision science paradigms to measure perceptual behaviors associated with viewing scatterplots. The analysis below follows the order of components from the design space presented in Elliott et al., (in revision), but readers should note that there is no “correct” ordering – it is appropriate to start from any level of the design space.
The Perception of Correlation in Scatterplots – Rensink & Baldridge (2010)
Research questions:
- How sensitive are observers to differences in correlations?
- How accurate and precise are subjective estimates of correlation?
To answer the two research questions, the authors designed two corresponding main tasks in Section 2 of this paper: a discrimination task (2.1) and a direct estimation task (2.2). The discrimination task was used to measure viewer sensitivity in correlation perception, and the estimation task was used to measure viewer accuracy and precision in correlation perception. We analyze each task according to the design space here:
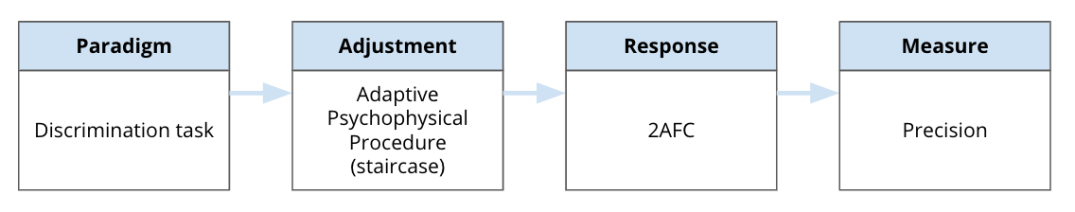
The Discrimination Task (section 2.1)

Paradigm: What tasks did the viewers complete?
- The discrimination task was used to measure viewer sensitivity in correlation perception. Discrimination tasks are described in section 4.7 of the design space paper. In this study, viewers are presented with two scatterplots and asked to choose which scatterplot is more highly correlated.
- Design space users can evaluate authors’ choice of paradigm based on their stated goals and the advantages and disadvantages listed. In this case, the authors’ choice is consistent with the advantages listed for both methods (e.g., discrimination tasks are a good choice for measuring precision, and work well with a variety of complex stimuli). The authors designed this experiment to be a within-subject comparison, recruiting a small sample (20 participants). They focused on measuring individual accuracy and precision to identify correlation JNDs and create psychometric functions, which inevitably makes the experiment somewhat time-consuming for each participant. Both discrimination and estimation tasks are designed for obtaining a full psychometric function. They allow each level of the stimulus to be systematically manipulated to suit the within-subject design where one participant has to experience all levels of the stimulus.
Adjustment Types: How were stimulus levels adjusted?
- For the discrimination task, the authors applied a staircase method to combat noisiness in viewer responses. They adjusted the level of correlation until viewers reached a 75% steady state performance. A schematic of the authors’ chosen algorithm is shown in Figure 2. Referencing Section 5.4 of the design space, we see that staircasing is a common adaptive psychophysical procedure, rendering it a good choice for reducing noise in viewer responses. Adaptive staircasing accommodates viewer differences, by making the task easier and harder according to each trial response, until a consistent level of performance is achieved. Note the degrees of freedom in this design process. While staircasing allowed for dynamic testing from both above and below the target correlation value in their paradigm, the authors could have used any of the other adjustment types for this task!
Response Types: How did the viewers respond to the tasks?
- The authors use a version of a 2AFC response type. Viewers used key presses to choose which of two scatterplots was more highly correlated (task depicted in Figure 1 in Rensink & Baldridge, 2010). This task type is described in section 6.2 of the design space. Note that the authors combat one of the limitations of 2AFC tasks, anchoring effects, with the use of their adaptive staircase procedure.
Dependent Measures: How was performance measured?
- The authors measured precision, or viewer sensitivity, by examining the average JNDs for each correlation value (0.1 through 0.9) both from above and below (see Figure 4 in our paper), and fitting a least-squares function to the JND data. They supplemented their results with average time to make a discrimination between plots. Both of these dependent measures and the subsequent analysis were made possible by the experiment design. It is important to identify the planned analysis beforehand, working backwards to ensure that the data needed for such an analysis can be reliably gathered with the paradigm, method, and response type chosen.
The Estimation Task (section 2.2)

Paradigm: What tasks did the viewers complete?
- The estimation task was used to measure viewer accuracy in correlation perception. Estimation tasks are described in section 4.9 of the design space paper. In this study, viewers were presented with three scatterplots, and asked to adjust the correlation of the middle scatterplot until its correlation was halfway between that of the two adjacent scatterplots.
Adjustment Types: How were stimulus levels adjusted?
- For the estimation task, the authors use a method of adjustment. Viewers are presented with two high-correlation and low-correlation reference scatterplots, as well as a plot that they adjust the correlation value of until it meets their subjective impression of a halfway point between the two reference plots. This procedure is repeated over multiple reference correlation levels, corresponding to subjective estimates of ⅛, ⅜, ⅝, and ⅞. This recursive version of the method of adjustment is a unique variation that promotes viewer consistency across trials. This variation is sometimes called a “bisection” task, where the estimation itself is a perceptual decision/representation (e.g., indicating the visual halfway point between two values), rather than a magnitude production task (e.g., asking participants to type in a correlation value estimate), which can often produce noisier results (Odic & Starr, 2018).
Response Types: How did the viewers respond to the tasks?
- The authors use a stimulus level response type. Viewers adjusted scatterplots’ level of correction until they felt the scatterplot appeared halfway between two reference scatterplots. This is a form of direct reporting (of the subjective halfway point between reference correlation values, in this case). The recursive variation they chose helped combat bias and inconsistency as potential limitations, but required more time to complete each trial.
Dependent Measures: How was performance measured?
- The authors measured accuracy through stimulus level subjective estimates of correlation value (e.g., the halfway point between two reference correlations). Note that this does not capture precision, and that estimation tasks are not good measure of precision.

Alternative Designs to Study The Perception of Correlation in Scatterplots
The experiment design chosen by Rensink & Baldridge (2010) is scientifically sound, and yielded highly consistent behaviors across participants – producing a clear perceptual signal to model. However, the studies could have been designed differently to study the same two ideas: precision of correlation perception and accuracy of correlation perception. Here, we use our design space to describe some possible alternatives. We hope to make two things clear with this thought experiment: 1) that experiment design is sometimes an art, and each level of choices contains a unique set of trade offs in terms of advantages and limitations, and 2) that our design space can help researchers avoid running bad experimental designs, by considering these documented trade offs earlier.
The Discrimination Task
Paradigm alternative:
For this task, the author’s goal was to understand viewer sensitivity of correlation perception. As an alternative to a discrimination, the authors could have used a matching paradigm (see Section 4.6 in the design space). Matching paradigms can also be used to obtain perceptual thresholds of sensitivity (e.g., how similar two scatterplots must look to be perceptually indistinguishable). A matching task would also have been useful for comparing viewer consistency across trials, but might have taken a longer time for viewers to complete, and also might have required more trials to obtain the full psychometric function.
Adjustment alternative:
Suppose the authors wanted to keep the discrimination paradigm, but they didn’t want the task to take as long to complete. In this case, they could have used a method of constant stimuli (see Section 5.3 of the design space) adjustment with no staircasing. This would not have given the same level of precision in viewer responses, but would save time with fewer overall trials. The method of constant stimuli only requires one trial per level of correlation, meaning that more subconditions would be needed to obtain a complete psychometric function.
Response alternative:
If the authors chose to use a matching task to obtain sensitivity, a better response type would be the stimulus level (see Section 6.1 of the design space), as viewers could adjust a reference scatterplot correlation to match a target.
Dependent Measure alternative:
Using a matching paradigm and recording the correlation level of an adjustable reference plot would still produce a JND at each correlation level/subcondition tested in the matching task. These JNDs could be modeled with the same analysis procedure as the original design in Rensink & Baldridge (2010). This result could be compared with the original finding to determine which method yields a more sensitive description of viewer precision.
The Estimation Task
Paradigm alternative:
For this task, the author’s goal was to understand viewer accuracy of correlation perception. Estimation tasks are the best way to study accuracy in the context of visual attention (see Section 4.9 in the design space), so an alternative paradigm would not be appropriate for this research question.
Adjustment alternative:
The method of adjustment was a good choice for the bisection task used in the original design. However, there are alternatives that could pair with different response types. One example could be using the method of constant stimuli (Section 5.3 in the design space) to display different levels of correlation, and asking viewers to perform a straightforward direct estimate at each level (continued below…).
Response alternative:
Viewers could be asked to choose a correlation value from a selection of possibilities (NAFC – Section 6.3 of the design space), or to produce a correlation magnitude and type it into a text field (stimulus level – Section 6.1 of the design space). Both of these would still be valid forms of estimation that measure accuracy.
Dependent Measure alternative:
Both of the alternatives suggested would still yield subjective correlation magnitude estimates to measure accuracy. However, an NAFC task might artificially inflate the precision of responses (depending on how many choices and how much variability exists between those choices), and a magnitude production with text entry might result in noisy/biased results across viewers. Both of these would likely take less time than the original task – another tradeoff to consider.
