2:00-2:05 pm: Introduction
2:05-2:11 pm: Open vs Closed Perceptual Categories Persist in the Context of Overplotting and with Real-World Data – David Burlinson
2:17-2:23 pm: Perceptual averaging in visual communication: Ensemble representations in the perception of scientific data in graphs – Stefan Uddenberg
2:23-2:29 pm: Data Visualization in Introductory Psychology Textbooks – Jeremy Wilmer
2:29-2:35 pm: Using Analogies to Teach Novel Graphics – Emily Laitin
2:35-2:41 pm: Missing the forest and the trees in animated charts – Nicole Jardine
2:41-2:47 pm: Exploring Attention on Large-scale Visualizations using ZoomMaps, a Zoomable Crowdsourced Interface – Anelise Newman
2:47-2:53 pm:The role of spatial organization for interpreting colormap data visualizations – Shannon Sibrel
2:53-3:08 pm: All presenters on panel Q&A
3:08-3:23 pm: Guest speaker Brian Fisher
3:23-3:38 pm: JOV special edition editor presentation and Q&A
3:38-4:30 pm: “Meet & Greet” with refreshments
This event was sponsored by Adobe Inc., the Visual Thinking Lab at Northwestern, and Colorado Boulder’s VisuaLab.
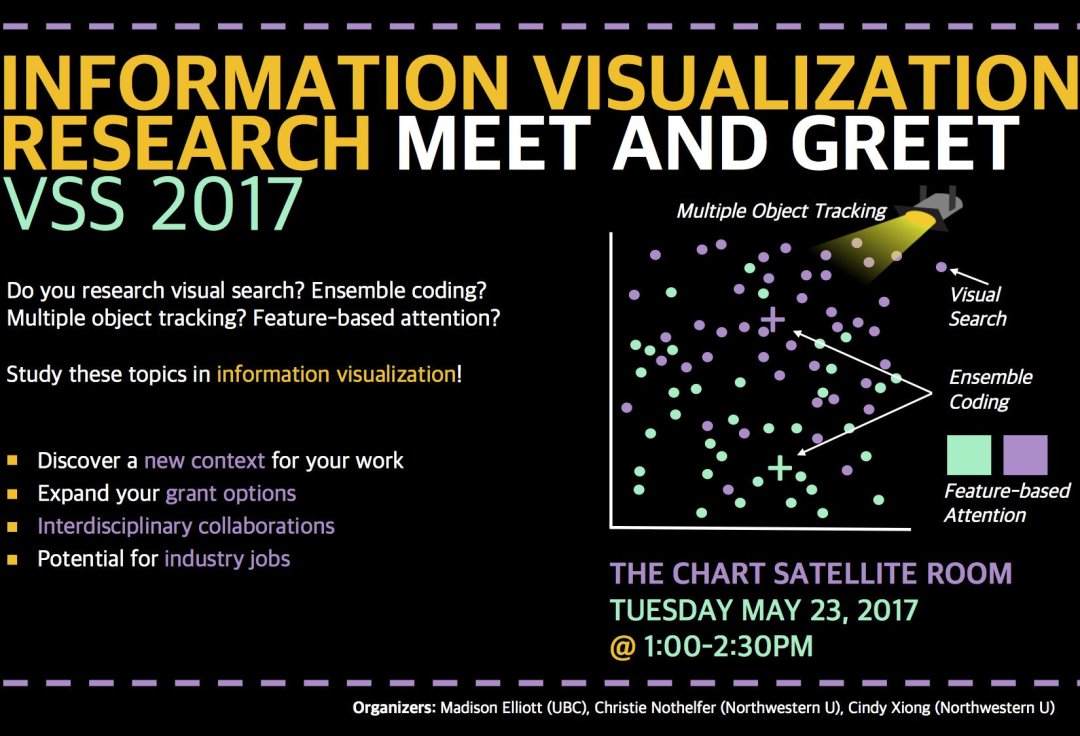
Data is ubiquitous in the modern world, and its communication, analysis, and interpretation are critical scientific issues. Visualizations leverage the capabilities of the visual system, allowing us to intuitively explore and generate novel understandings of data in ways that fully-automated approaches cannot. Visualization research builds an empirical framework around design guidelines, perceptual evaluation of design techniques, and a basic understanding of the visual processes associated with viewing data displays. Vision science offers the methodologies and phenomena that can provide foundational insight into these questions. Challenges in visualization map directly to many vision science topics, such as finding data of interest (visual search), estimating data means and variance (ensemble coding), and determining optimal display properties (crowding, salience, color perception). Given the growing interest in psychological work that advances basic knowledge and allows for immediate translation, visualization provides an exciting new context for vision scientists to confirm existing hypotheses and explore new questions. This symposium will illustrate how interdisciplinary work across vision science and visualization simultaneously improves visualization techniques while advancing our understanding of the visual system, and inspire new research opportunities at the intersection of these two fields.
Historically, the crossover between visualization and vision science relied heavily on canonical findings, but this has changed significantly in recent years. Visualization work has recently incorporated and iterated on newer vision research, and the results has been met with great excitement from both sides (e.g., Rensink & Baldridge, 2010; Haroz & Whitney, 2012; Harrison et al., 2014; Borkin et al., 2016; Szafir et al., 2016). Unfortunately, very little of this work is presented regularly at VSS, and there is currently no dedicated venue for collaborative exchanges between the two research communities. This symposium showcases the current state of vision science and visualization research integration, and aspires to make VSS a home for future exchanges. Visualization would benefit from sampling a wider set of vision topics and methods, while vision scientists would gain a new real-world context that simultaneously provokes insight about the visual system and holds translational impact.
Ron, Danielle, Cindy, Madison, Christie, and Steve.
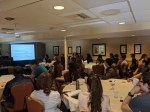
We hosted our first event on May 23, 2017: an informal VSS satellite meeting for vision science researchers to learn about and discuss the field of information visualization!
The meeting began with a presentation about what InfoVis research is like, and why cognitive psychologists might care about it. Next, research talks were given by Madison Elliott, Cindy Xiong, Christie Nothelfer, Danielle Albers-Szafir, and Zoya Bylinskii, who all conduct research at the intersection of visualization and vision science. The meeting concluded with a round table introduction, discussion, and contact/idea exchange. Hopefully this meeting was the start of many more collaborative events!
Talks:
Changing task demands limits feature based attention. Madison Elliott & Ron Rensink (University of British Columbia).
Curse of knowledge in visual data communication. Cindy Xiong & Steve Franconeri (Northwestern University).
Rapid feature-selection benefits from feature redundancy. Christie Nothelfer & Steve Franconeri (Northwestern University).
Designing for data and vision: ensembles, constancy, and color models. Danielle Albers Szafir (University of Colorado – Boulder).
How studying the perception of visualizations is like studying the perception of scenes. Zoya Bylinskii & Aude Oliva (Massachusetts Institute of Technology).
Slides from opening talk available here: VSS_InfoVis